
A Guide to Social Media Engagement Metrics
Published
Social media engagement metrics are the vital signs of your online presence. They track every way your audience interacts with your content. Think of it like this: a 'like' is a quick thumbs-up, a 'comment' starts a real conversation, and a 'share' is the ultimate compliment—a personal recommendation to a friend.
Why Engagement Is Your Most Important Signal

It’s easy to get caught up in follower counts, but that's a classic vanity metric. A massive following might look great on paper, but it means very little if no one is actually listening. Real influence isn't about having the biggest audience; it's about having the most active and invested one. Engagement metrics are how you measure that deep connection.
Imagine you're a comedian on stage. Would you rather perform for a stadium of 10,000 people sitting in dead silence, or a small club of 100 people laughing, clapping, and talking about your jokes afterward? The answer is obvious. The active club is where the real magic happens, and engagement metrics give you that same invaluable feedback online.
The Declining Engagement Landscape
Here's the tough truth: getting and keeping someone's attention today is harder than ever before. Social media is incredibly crowded. As of early 2025, even with 63.9% of the world's population using social platforms, the average engagement rates have been plummeting.
The data is sobering. Facebook's engagement has dropped by a staggering 36%, and Instagram's has fallen by 16%. You can dig deeper into these social media benchmark shifts to see just how competitive the space has become. This trend makes one thing crystal clear: you can't just post and pray anymore. Your content has to earn a reaction.
Engagement is the currency of modern social media. It signals to algorithms that your content is worth showing to more people, boosting your organic reach. Without it, you're essentially shouting into a void.
From Passive Followers to Active Community
This is where a solid understanding of engagement metrics pays off. By seeing what truly gets people to act, you can stop guessing and start creating content that builds a genuinely loyal community, not just a list of passive followers.
To help you get started, here's a quick rundown of what the most common engagement metrics really mean for your strategy.
Your Guide to Primary Engagement Metrics
| Metric | What It Measures | Strategic Importance |
|---|---|---|
| Likes/Reactions | Quick, low-effort approval of your content. | A good at-a-glance indicator of what resonates on a surface level. Easy to get, but the least impactful. |
| Comments/Replies | Direct audience conversation and feedback. | The start of a real dialogue. Offers qualitative insights, builds community, and shows high interest. |
| Shares/Reposts | When users broadcast your content to their own network. | The digital equivalent of word-of-mouth. Amplifies your reach organically and acts as a strong endorsement. |
| Saves/Bookmarks | Users saving your content for future reference. | A powerful signal of high-value, "evergreen" content. Shows your audience finds it useful enough to return to. |
By tracking these actions, you shift your entire approach from simply broadcasting messages to sparking meaningful conversations. It's this focus on building real relationships that creates the trust and loyalty you need to win at influencer marketing for the long haul.
Measuring What Matters Beyond Likes
It’s easy to get a little thrill from a wave of likes on a post. We’ve all been there. But if you're serious about your strategy, you know that likes are just the tip of the iceberg. True engagement runs much deeper.
Think of social media engagement metrics as the different chapters in the story of your audience's relationship with your brand. To really understand that story, you have to look beyond the surface-level signals and see how people are truly interacting with what you put out there. Digging into the nuances is key, and it's worth exploring different ways of how to measure social media engagement effectively to get the full picture.
We can break down this story into four main pillars. Each one represents a different level of investment from your audience—from a simple head-nod to a full-blown recommendation.
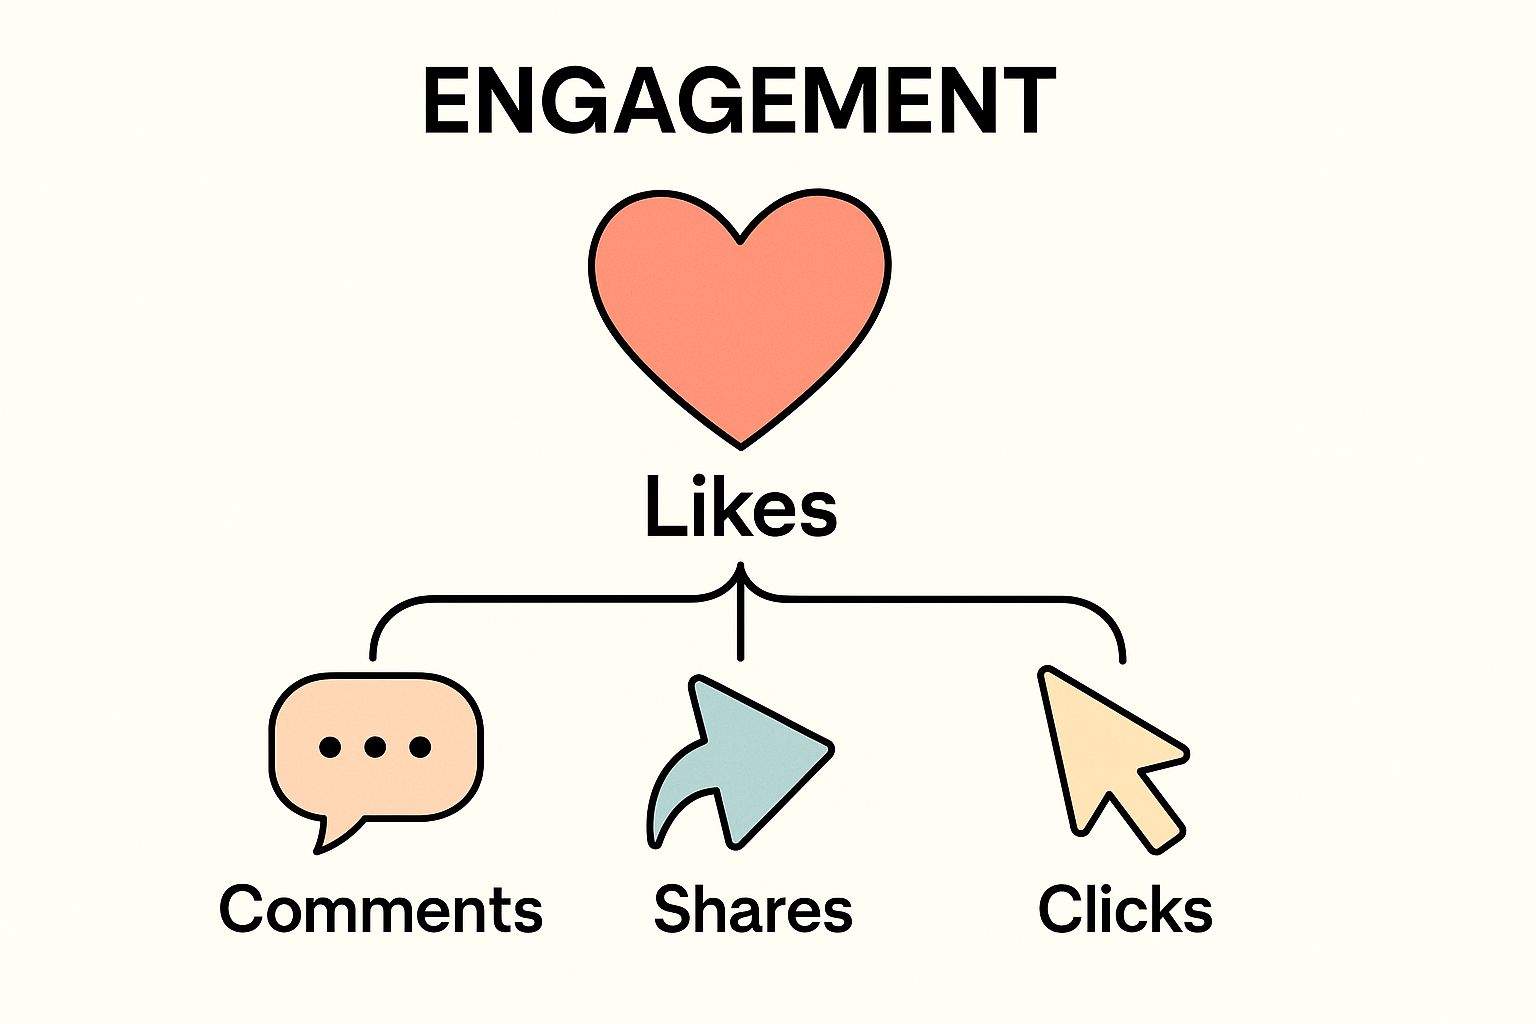
As the infographic shows, actions like shares and clicks carry a lot more weight than a simple 'like'. They signal a much stronger connection and a higher level of commitment from your audience.
The Applause Pillar
This is the most straightforward type of engagement. Think of it as the digital equivalent of a crowd clapping—it’s quick, easy, and shows immediate approval.
- Likes and Reactions: These are your most basic feedback loops. They tell you your content caught someone’s attention and they had a positive, if fleeting, reaction.
- Saves and Bookmarks: This is where applause gets interesting. A save is a huge compliment. It means your content isn't just likable, it's so valuable that someone wants to come back to it later. This is a gold-star indicator for useful, high-quality material.
Applause metrics are a good start, but they don't tell the whole story. They confirm that people see and appreciate your content, but not necessarily how much it truly resonated with them.
The Interaction Pillar
This is where things get conversational. Interaction is the moment your content stops being a monologue and starts a dialogue, turning passive viewers into an active community.
Comments and replies are the lifeblood here. Every comment is a chance to learn directly from your audience, answer their questions, and make them feel seen and heard. Direct Messages (DMs) take it a step further, signaling a level of trust and personal interest that a public comment might not.
Think of your comments section as a free, real-time focus group. It gives you raw, honest feedback on what's working, what's confusing, and what gets people excited—insights that raw numbers could never provide.
The Amplification Pillar
Amplification is when your audience starts doing your marketing for you. These are the actions that carry your message beyond your own bubble, introducing it to entirely new circles of people. It’s the modern-day word-of-mouth.
The heroes of this pillar are shares, retweets, and reposts. When someone shares your post, they're essentially co-signing your message and vouching for it with their own reputation. That’s a massive signal of trust.
To get a handle on this, you can calculate your Amplification Rate:
(Total Shares per Post / Total Followers) * 100
A strong amplification rate means your content isn't just good; it's share-worthy. It shows you're successfully turning followers into genuine advocates. Keeping an eye on these kinds of essential influencer marketing KPIs is critical to understanding your campaign’s organic reach.
The Conversion Pillar
Finally, we get to the pillar that ties it all back to business results. Conversion is where social media engagement translates into meaningful action that directly impacts your goals.
Key metrics to watch in this category include:
- Click-Through Rate (CTR): This shows how many people were intrigued enough by your post to click a link, whether it leads to a blog, a landing page, or a product.
- Lead Form Submissions: For many businesses, this is the goal. It tracks how many people were motivated to hand over their information after seeing your social post or ad.
- Sales: The ultimate conversion for e-commerce. This tracks how many sales can be directly traced back to your social media channels.
These actions prove your content did its job—it moved someone from being a passive observer to an active participant. By tracking conversions, you’re making sure your social media efforts aren't just creating buzz, but are actually driving real, measurable growth.
So, you've got a handle on the key social media engagement metrics. That's a great start. But the real magic happens when you can boil all those likes, comments, and shares down into one powerful number: your engagement rate. Think of it as your content's report card—it gives you a straightforward way to see what's working (and what's not) across all your posts and campaigns.
But here’s something most people don't realize: there isn't one single "right" way to calculate it. The best formula really depends on the question you're trying to answer. Are you curious about how many of your loyal followers are tuning in? Or do you want to know how compelling your content was to every single person who saw it? Each calculation tells a different part of the story.
And that story is getting more complex. In 2025, we're looking at a world with roughly 5.42 billion social media users. That’s nearly 68% of everyone on the planet! On top of that, the average person is active on 6.83 different platforms each month. This is exactly why having a standardized way to measure what works is no longer a nice-to-have; it's essential. For a deeper dive into these numbers, the latest social media statistics from Sprout Social offer some incredible context.
Let's break down the main ways to calculate your engagement rate.
The Follower-Based Method
This is the old faithful of engagement calculations. It's the most common and direct way to see what percentage of your audience is interacting with your content. It’s a fantastic, high-level metric for monitoring the health of your community over the long haul.
Because your follower count is a stable, public number, this formula is super easy to use. It fundamentally answers the question: "Of all the people who chose to follow me, how many are actually paying attention?"
Calculation Corner: ER by Followers
(Total Engagements on a Post / Total Followers) * 100For example: Let's say you have 10,000 followers. You make a post that gets 450 likes and 50 comments, for a total of 500 engagements. Your engagement rate for that post is 5%.
The Reach-Based Method
The follower method is great, but it has one big flaw: not all of your followers will see every single one of your posts. Thanks, algorithms! This is where calculating engagement by reach gives you a much more honest assessment of your content's quality.
This formula tells you how well your content performed with the people who actually had it pop up in their feed. It’s often seen as the truest measure of a post’s appeal because it strips away the algorithm's influence and focuses purely on how compelling the content itself was. A high engagement rate by reach means you created something that genuinely resonated.
Calculation Corner: ER by Reach
(Total Engagements on a Post / Reach of that Post) * 100For example: Your post was shown to 3,000 people (its reach) and racked up 300 engagements. Your engagement rate by reach is a very strong 10%—a number that tells a much better story than the follower-based calculation might have.
The Impression-Based Method
Finally, we have the impression-based method. This one is a bit different. Impressions track the total number of times your content was displayed on a screen. This means if one person saw your post in their feed and then again when a friend shared it, that counts as two impressions but only one person reached.
So, when would you use this? It’s incredibly valuable for paid advertising. When you're putting money behind a post, you want to know how effective it is every time it appears. This helps you gauge if your creative is grabbing attention, even if people are seeing it multiple times.
So, which one should you use? Here’s a quick cheat sheet:
- ER by Followers: Your go-to for tracking overall community engagement and for quick competitor analysis (since you can see their follower counts).
- ER by Reach: The best choice for judging the true quality and resonance of your individual content pieces.
- ER by Impressions: A must-have for paid social campaigns to measure the effectiveness of your ad creative with each view.
By getting comfortable with these different formulas, you can stop looking at engagement as a single, vague metric. Instead, you can start digging into the specific stories your data is telling you, helping you make smarter, more effective decisions about your entire content strategy.
Benchmarking Metrics Across Social Platforms
Not all engagement is created equal. A 1% engagement rate might be cause for celebration on one platform but a huge red flag on another. Understanding why is the key to setting goals that make sense and building a strategy that actually works.
Think of it like this: you wouldn't wear a tuxedo to a backyard barbecue. In the same way, the in-depth industry analysis that shines on LinkedIn will almost certainly bomb on TikTok. A one-size-fits-all approach is a recipe for frustration, so you have to adapt your content to fit the room.
Matching Your Content to the Platform
So, what's going on behind the scenes? Every platform's algorithm is wired differently, looking for specific user signals to decide what content gets pushed out.
- TikTok’s algorithm is all about watch time and shares. It’s a clear signal that a video is entertaining enough to keep people glued to their screens and eager to pass it along.
- LinkedIn, on the other hand, prioritizes thoughtful comments and relevant shares within a professional network. It's looking for content that sparks industry conversation.
This is why a viral dance challenge feels right at home on TikTok, while a detailed company case study belongs on LinkedIn. When you get these fundamental differences, you can start creating content that aligns with what each platform's users—and its algorithm—are actively looking for.
Benchmarking isn't about chasing a single "good" number. It's about understanding the unique culture of each platform and measuring your success against the right standard. A win on Facebook looks very different from a win on Instagram.
A Platform-by-Platform Snapshot
To really nail your social media engagement metrics, you need to know the general rules of the road for each network. While the exact numbers will always shift a bit depending on your industry, the benchmarks below give you a solid starting point for seeing how you stack up. This context is what tells you if your engagement is healthy or if it's time for a strategy tune-up.
Let's take a look at what "good" looks like across the big players.
Platform Engagement Snapshot
Here's a quick comparison of what you can generally expect from each major social network, from average engagement rates to the kind of content that performs best.
| Platform | Average Engagement Rate (Industry Dependant) | Best Performing Content Type | Primary Audience Goal |
|---|---|---|---|
| 0.5% - 1.5% | High-quality visuals (Reels, Carousels) | Inspiration and visual discovery | |
| 0.1% - 0.5% | Community-building content (videos, user-generated content) | Connection and information sharing | |
| TikTok | 3% - 9% | Short-form, entertaining video (trends, tutorials) | Entertainment and trend participation |
| X (Twitter) | 0.03% - 0.1% | Real-time updates, news, and conversations | Timely information and public discussion |
| 2% - 5% | Professional insights (articles, text-based posts) | Career development and networking |
As you can see, the differences are stark. A 0.5% engagement rate is a solid performance on Facebook, but that same number would be a massive flop on TikTok, where rates often climb past 5%.
This all comes down to user intent. People scroll X (formerly Twitter) for real-time news bites, while they visit LinkedIn to advance their careers, making them much more likely to engage with deep, professional content. When you stop comparing apples to oranges, you can set smart, achievable goals for each channel. This focused approach ensures you're putting your energy where it will make the biggest difference, all by learning to speak the native language of each platform.
Using Tools to Track Engagement Smarter

Let's be honest: manually tallying every like, comment, and share across all your social platforms is a fast track to burnout. Thankfully, you don't have to. There's a much smarter way to monitor your social media engagement metrics that saves you time and gives you far better insights. This is how you stop counting and start understanding what your audience actually cares about.
Your first stop should be the tools you already have access to. Every major platform has its own built-in analytics, like Meta Business Suite for Facebook and Instagram or the analytics suite inside TikTok. These are fantastic, free resources that give you reliable data on core metrics like reach, engagement rate, and audience demographics straight from the source.
But to really get the full story, you'll eventually need to look beyond the native tools.
Beyond Basic Tracking with Advanced Tools
While the built-in analytics are great for seeing what's happening on your own profiles, dedicated social media tools give you a panoramic view of the entire landscape. Instead of just seeing your own report card, you get to see how you measure up against everyone else.
What can these advanced tools do for you?
- Competitive Benchmarking: Finally, an answer to "How are we really doing?" See how your engagement and growth stack up against your direct competitors.
- Trend Identification: These platforms are constantly scanning the horizon, automatically flagging rising trends, hot hashtags, and viral audio you can jump on.
- Sentiment Analysis: This is where it gets interesting. You can go beyond the raw numbers to understand the feeling behind the comments—are people happy, frustrated, or just neutral?
Sentiment analysis is a true game-changer. It helps you understand the "why" behind the what. A post might get a ton of comments, but if they're all negative, that's not a win to celebrate—it's a problem you need to solve.
These features turn your data from a simple historical record into a strategic roadmap, showing you not just what happened, but what you should do next.
The Rise of Social Listening and AI
Perhaps the biggest shift in engagement tracking is the move toward social listening. This isn't just about tracking your own mentions; it's about monitoring the entire social media ecosystem for conversations about your brand, competitors, and industry keywords. It's no surprise that companies using social listening are reportedly up to twice as confident in their campaign ROI. You can dive deeper into how social media statistics highlight this trend on talkwalker.com.
AI is pouring fuel on this fire by automating the analysis of all this chatter. AI-powered tools can sift through millions of conversations to pinpoint what your audience is worried about, spot potential brand ambassadors, and even alert you to a PR crisis before it explodes. For those looking to work more efficiently, exploring different management platforms or even specific Twitter automation tools to boost engagement can be a huge help.
Ultimately, the right tools help you graduate from simply collecting numbers to generating real, actionable intelligence. By automating the tedious work and leaning on AI for deeper insights, you can spend less time buried in spreadsheets and more time making smart decisions that actually grow your brand. A great way to keep it all organized is by using a social media analytics report template to structure your findings.
Turning Engagement Data Into Actionable Strategy
So, you've gathered all this engagement data. Now what? The numbers themselves don't mean much until you use them to make smarter decisions. It's time to move beyond simply knowing what happened and start asking why it happened—and what you should do next.
This is where you build a feedback loop. Every like, comment, and share from a past post should directly inform your next move. Instead of just throwing content at the wall and hoping something sticks, you’re using your own analytics as a roadmap. This is how you transform a collection of random posts into a focused, goal-crushing machine.
Building Your Action Framework
To make sense of the data without getting completely overwhelmed, you need a game plan. A solid framework keeps you focused on what actually drives growth and prevents you from getting lost in vanity metrics. It's a simple cycle: analyze, act, and repeat.
Here’s a practical, four-step approach to get started:
- Set Clear Objectives: Your engagement goals need to mirror your bigger business goals. Are you trying to build brand awareness? Drive people to your website? Capture leads? Each objective requires you to watch a different set of metrics and fine-tune your strategy accordingly.
- Analyze Content Performance: Dive into your analytics and sort your content from best to worst. Look for patterns. Do your tutorial videos always get more saves than your talking-head clips? Do posts that ask a direct question rack up more comments? Find those winning formulas and make them a core part of your playbook.
- Segment Your Audience Engagement: Don't just look at the total number of likes. Dig deeper to see who is engaging. Is your most active audience segment women aged 25-34 in a specific city? Knowing which groups are most responsive helps you create content that speaks directly to them.
- Test and Iterate Continuously: Social media is never "set it and forget it." You should constantly be testing. Try A/B testing your captions, your visuals, your posting times, and your calls-to-action. You’d be surprised how a small tweak can lead to a big jump in engagement over time.
A data-driven strategy isn't about chasing a single, perfect formula. It's about making a series of small, smart adjustments that add up over time. The goal is consistent improvement, not overnight perfection.
This systematic process creates a powerful cycle of learning and growth. For a closer look at how these principles apply more broadly, understanding the pillars of effective social media marketing can offer some great insights.
Ultimately, the lessons you learn from one campaign become the foundation for the next, making your efforts sharper and more effective each time. If you're looking to turn these skills into a career, our guide on how to become a social media marketer lays out a complete path. By consistently translating your social media engagement metrics into real-world action, you ensure your hard work pays off with real, measurable business growth.
Answering Your Top Questions About Engagement Metrics
Diving into social media analytics can feel like learning a new language. You start to see all these numbers, but what do they really mean for your brand? Let’s clear up some of the most common questions that pop up when you start tracking engagement.
What’s a Good Engagement Rate, Really?
This is probably the number one question everyone asks, and the honest answer is… it depends. Sure, you'll see industry benchmarks thrown around—like 1-3% being "average" on a platform like Facebook—but chasing a generic number is a fool's errand.
A far more powerful question to ask is, "Is our engagement rate improving over time?" Your real competition is your own past performance. Beating last month's numbers is a much better indicator of success than trying to match a competitor who has a completely different audience, budget, and strategy.
A "good" engagement rate isn't some magic number handed down from on high. It's a goal you set for yourself based on your industry, the platform you're on, and what you're trying to achieve. The real win is consistent progress.
How Often Should I Actually Check My Metrics?
It's tempting to hit refresh on your analytics page all day long, but that’s not a great use of your time. On the other hand, you can't just set it and forget it. The trick is to find a rhythm that keeps you informed without causing analysis paralysis.
Here’s a simple schedule that works for most brands:
- Daily Glance (5 Minutes): Take a quick look at your direct messages and new comments. This isn't about deep analysis; it's about being responsive and managing your community in real-time.
- Weekly Pulse Check: Once a week, spend a bit more time seeing which posts from the last seven days really hit the mark. This helps you understand what's working right now and lets you double down on successful formats.
- Monthly Strategy Review: This is your big-picture meeting. Zoom out and look at the broader trends. Are your saves going up? Is your amplification rate growing? Use this monthly data to make meaningful adjustments to your overall social media strategy.
Can High Engagement Ever Be a Bad Thing?
Yes, absolutely—and this is a trap many brands fall into. Getting a ton of likes and shares feels great, but if that buzz doesn't actually connect to your business goals, it’s just noise. We call these "vanity metrics" for a reason.
Think about it: a viral meme you post might get thousands of shares, but if it doesn't lead to a single click to your website, did it really help your business? This is what happens when your content is out of sync with what you ultimately want your audience to do.
The key is to bridge the gap between engagement and action. You need to pair that attention-grabbing content with a clear call-to-action. By also tracking metrics like your Click-Through Rate (CTR), you can make sure your audience isn't just entertained—they're taking the next step with your brand.
Ready to turn your passion for social media into a career? Influencer Marketing Jobs is the leading job board for finding your next opportunity in the influencer and digital marketing space. Explore job listings today!